Connector Keyade
x Google Data Studio
How do I export the data from Madmetrics KPI by Keyade to Google Data Studio?
Connect to Madmetrics KPI by Keyade directly in a Google Data Studio report and visualise your data.
The Data Studio Connector makes it easy for you to access all your Madmetrics data directly from Google Data Studio. Data from all the ad accounts views that you have connected to Madmetrics is available, and it is combined together using the same Dimensions that you have already set up in your Madmetrics Account.
A Madmetrics license is needed to use Madmetrics KPI by Keyade. To get access to the DataStudio connector your Madmetrics account needs to be enabled for DataStudio access. Please contact your Account Executive or email support@madmetrics.com if you do not have access.
How to add the Madmetrics KPI by Keyade Connector to DataStudio?
From Madmetrics
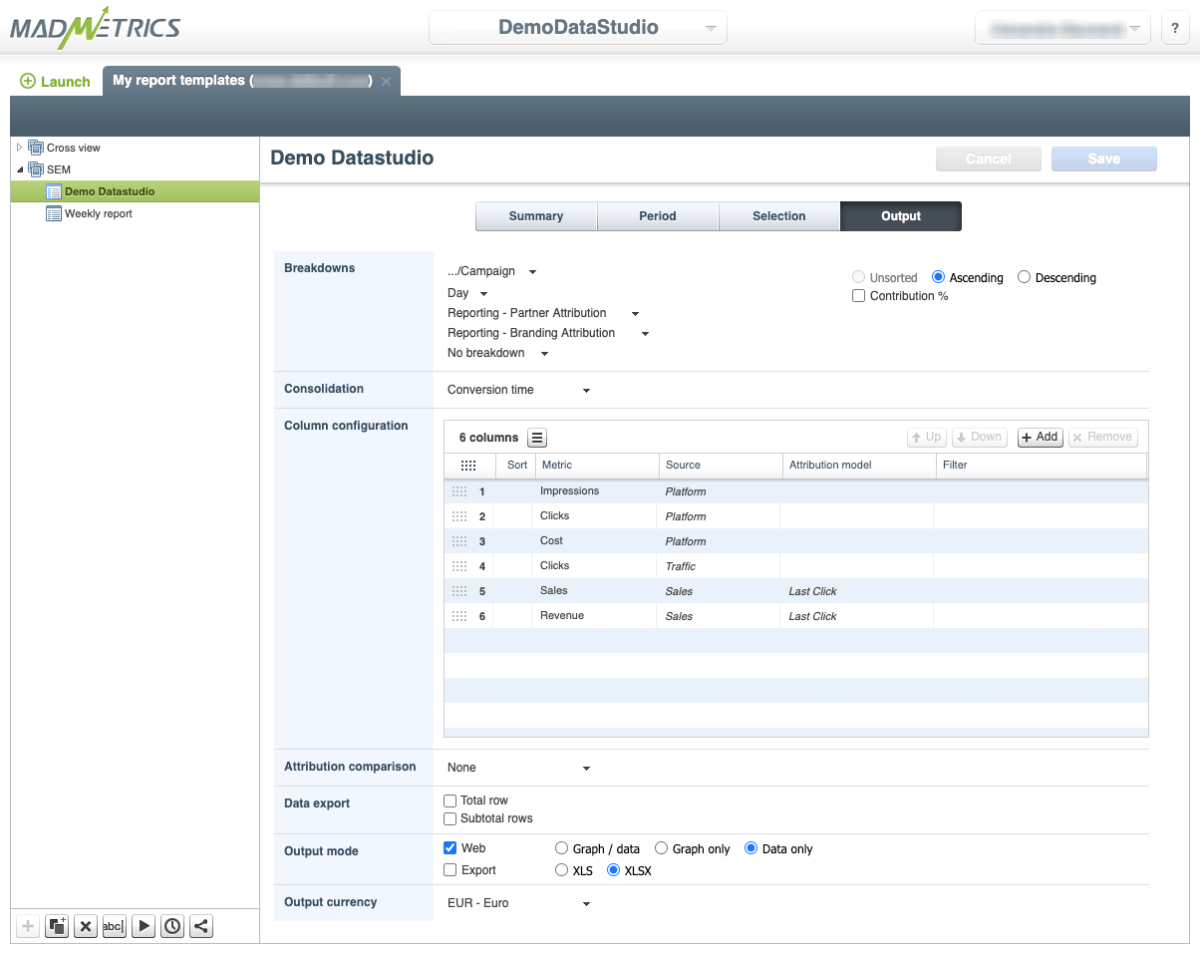
On your client account, go to the report template library. Create a new report or select an existing one. You need to be the owner of the template to be able to retrieve the token.
(Please note that day breakdown is mandatory and that the period does not matter and will be ignored).
Open the Template Application and generate the token.
Template application link : https://template-keyade.keyade.com/
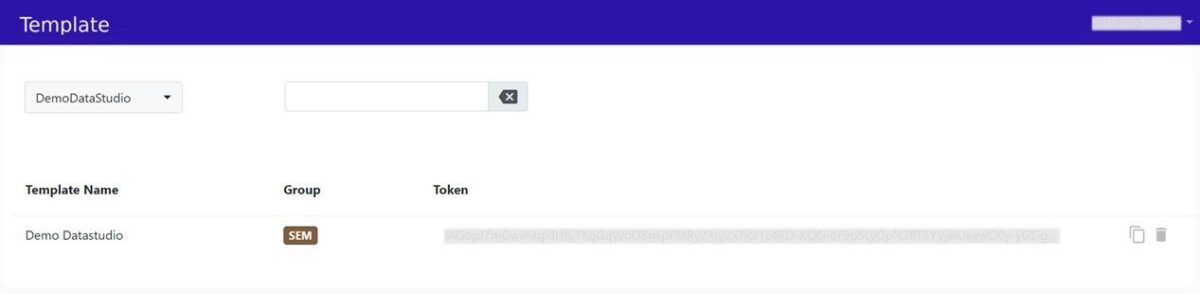
- Select your Madmetrics Account in the drop-down menu.
- You can see the list of the templates you own. You can apply a filter using the search box if needed.
- Click on ‘Generate token’ button.
- Click on ‘Copy’ button to retrieve the token.
Connecting in Data Studio and creating a new data source
In Data Studio, click the « Create » button and select « Data Source ». From there you can search for the Madmetrics KPI by Keyade Connector.
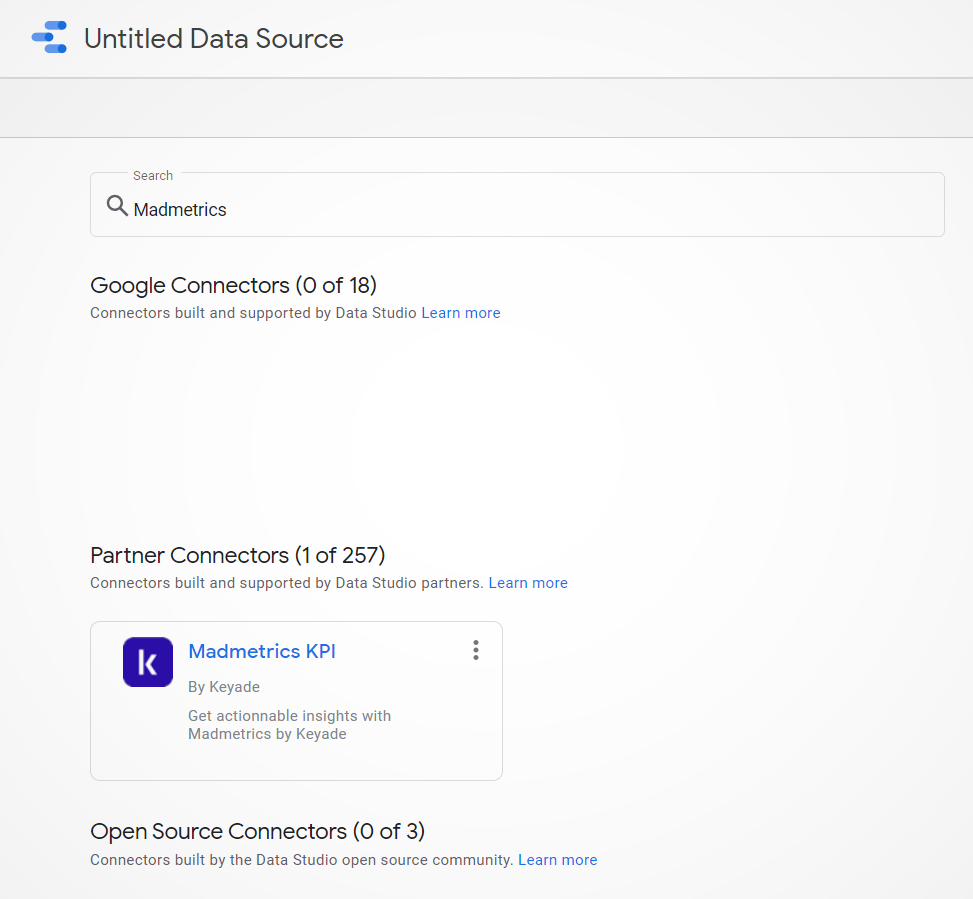
Select the Madmetrics KPI connector.
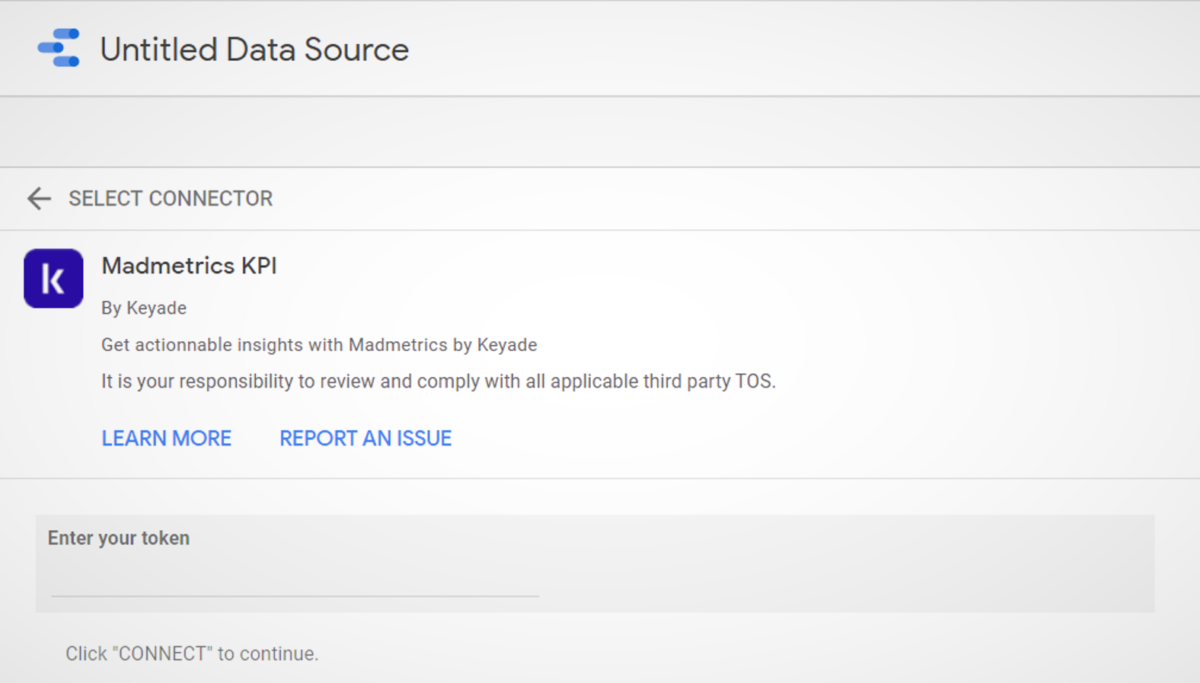
To access your data, enter the report template token (retrieved in the Template Application). Then click on « Connect ».
Set up Metrics in Data Studio
Once you are connected, Data Studio will show you a list of all the fields available from your Madmetrics Account. This includes both your Dimensions and Metrics.
If you would like to change the metrics names you can edit them by clicking on them directly.
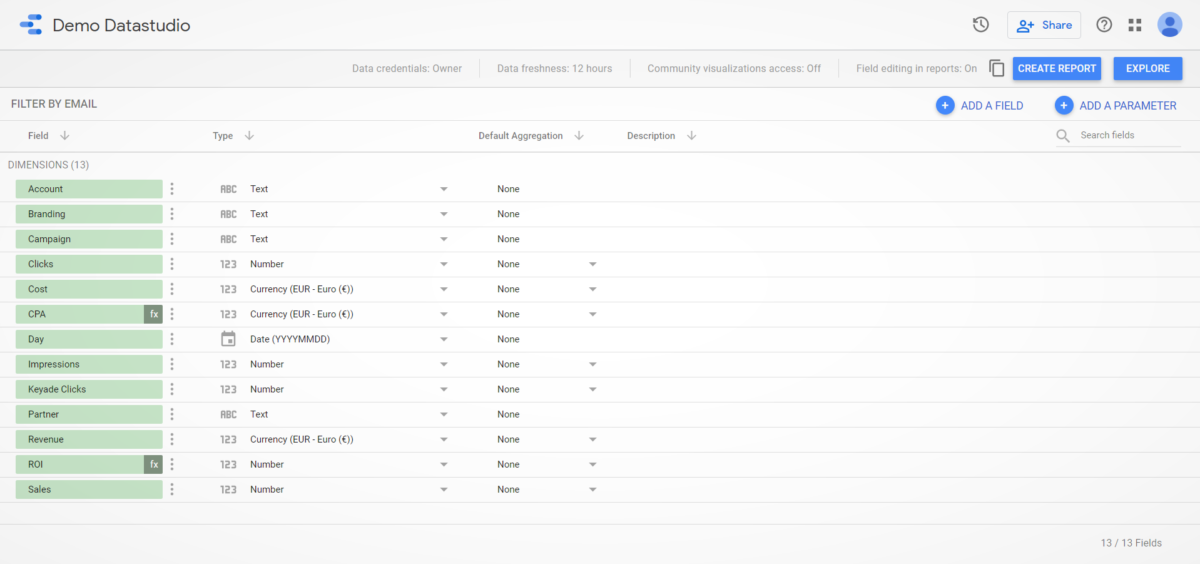
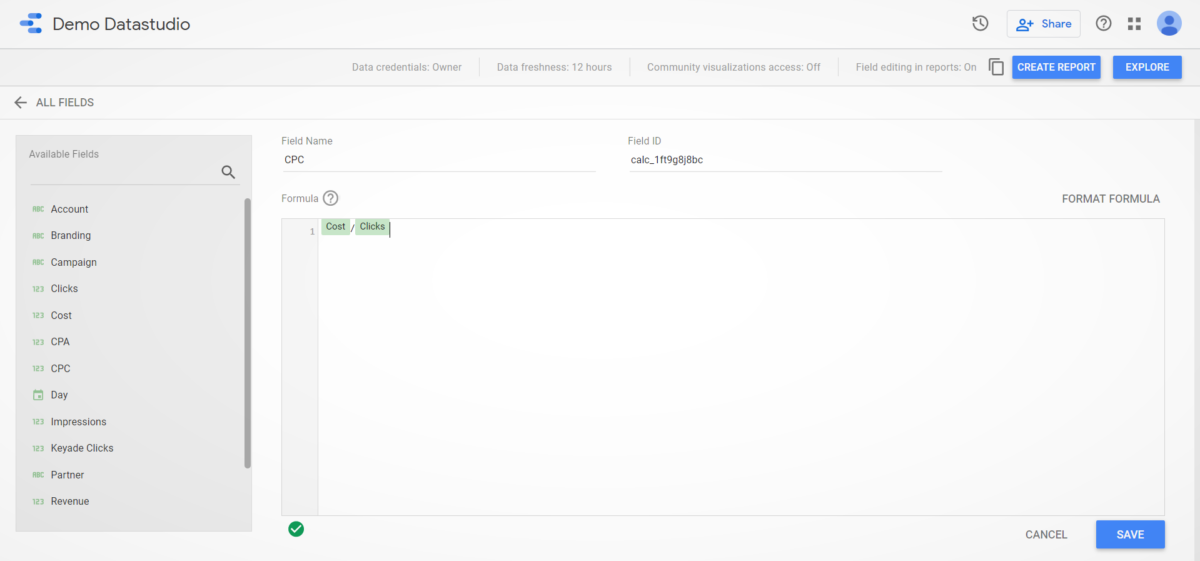
Though custom metrics/fields created in Madmetrics are available in Data Studio, you can also use the « + » symbol at the top of the list to create a new field in Data Studio directly. Below is an example of how you can calculate Cost Per Click:
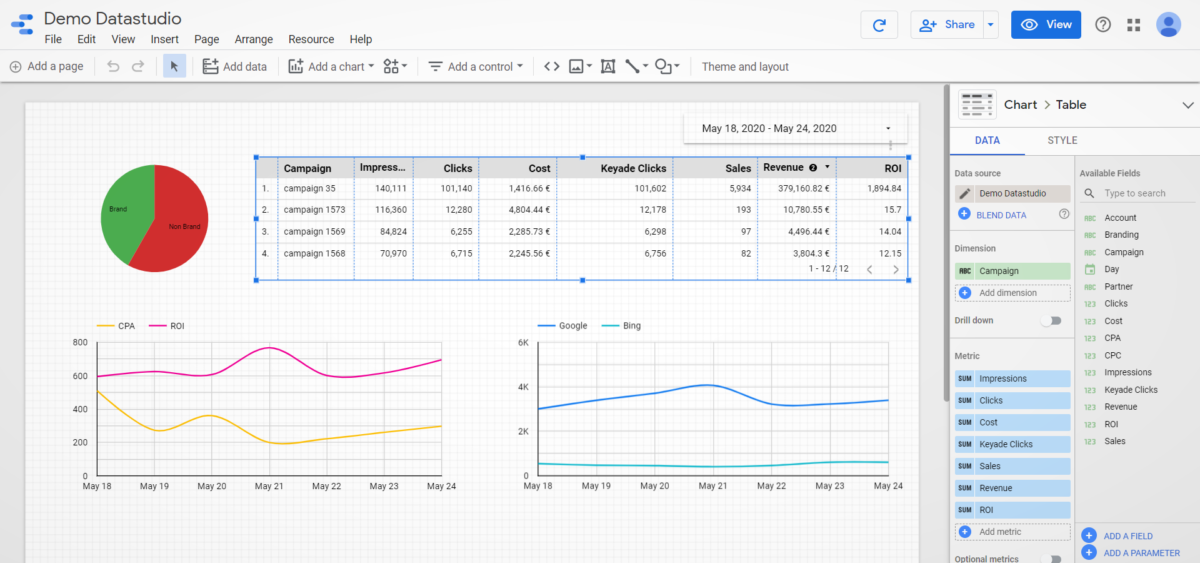
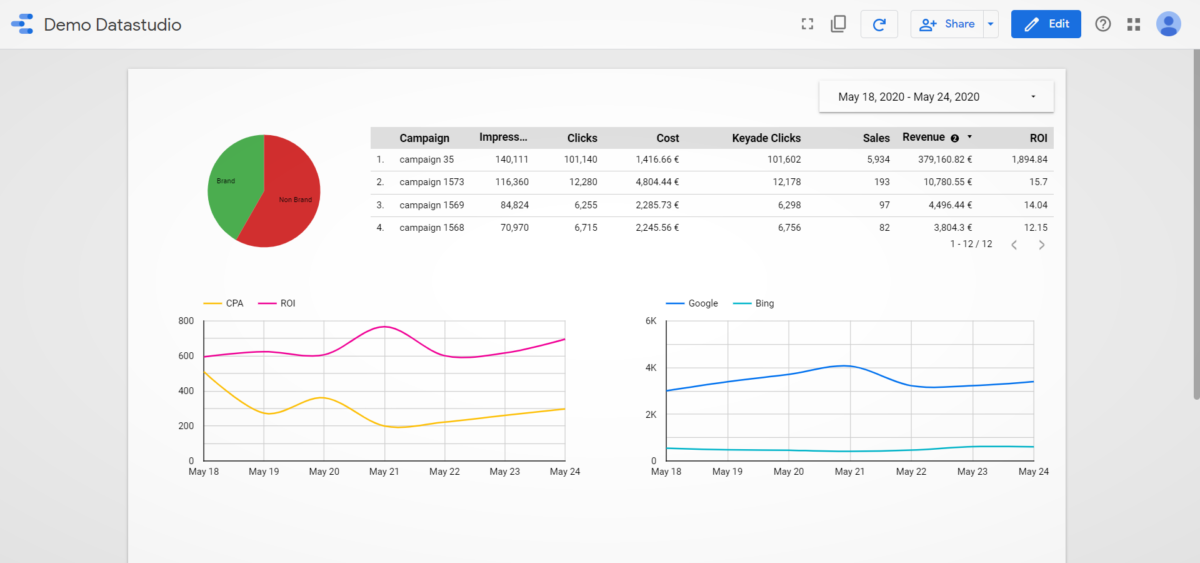
Visualize your data
When you have reviewed the fields, click « create report » and start adding widgets. As your Madmetrics Account may have a lot of fields, make sure to use the search feature of the « Metric Picker » to find the data you need.
All Madmetrics KPI by Keyade Terms of Use are available here